
Email: Adammunn71@gmail.com LinkedIn: Adam Munn

Robotics, Automation & Engineering Computation

Robotics, automation, MATLAB and practical coding

Selected work covering industrial automation support, COBOT and vision-system activity, MATLAB robotics simulation, and static website development.

Industrial COBOT and Vision-System Support

Provided industrial automation support during my placement year at Caterpillar, covering COBOT and vision-system activity in a live manufacturing environment. The work focused on production support, fault investigation, validation activity and inspection reliability for automated systems.

Published details are limited to tools, techniques and transferable engineering work. Site-specific architecture, layouts, images, production data, equipment locations and internal documentation are excluded.
COBOT support Vision systems Manufacturing automation Troubleshooting RCCA Validation checks Controlled disclosure

Role and contribution

Work included support for automated inspection systems, COBOT-related production issues, fault investigation, issue logging, root-cause and corrective-action activity, and coordination with internal and external stakeholders.

Tools and techniques

  • COBOT operational support and path-change awareness
  • Vision-system troubleshooting and inspection-confidence improvement
  • Deep-learning inspection model support
  • Regression checks and validation planning
  • Start-of-shift checks and production-readiness support
  • Root-cause corrective action and issue tracking

Engineering focus

The work sat at the interface between manufacturing engineering, automation, quality and technical support. The main objective was to improve confidence in automated systems while reducing avoidable production disruption.

Publication boundary

No site-specific images, system architecture, layouts, line details, equipment locations, production rates or internal documents are published. Any future images will be self-made diagrams or public/licensed generic imagery only.

RRT Path-Planning Simulation in MATLAB

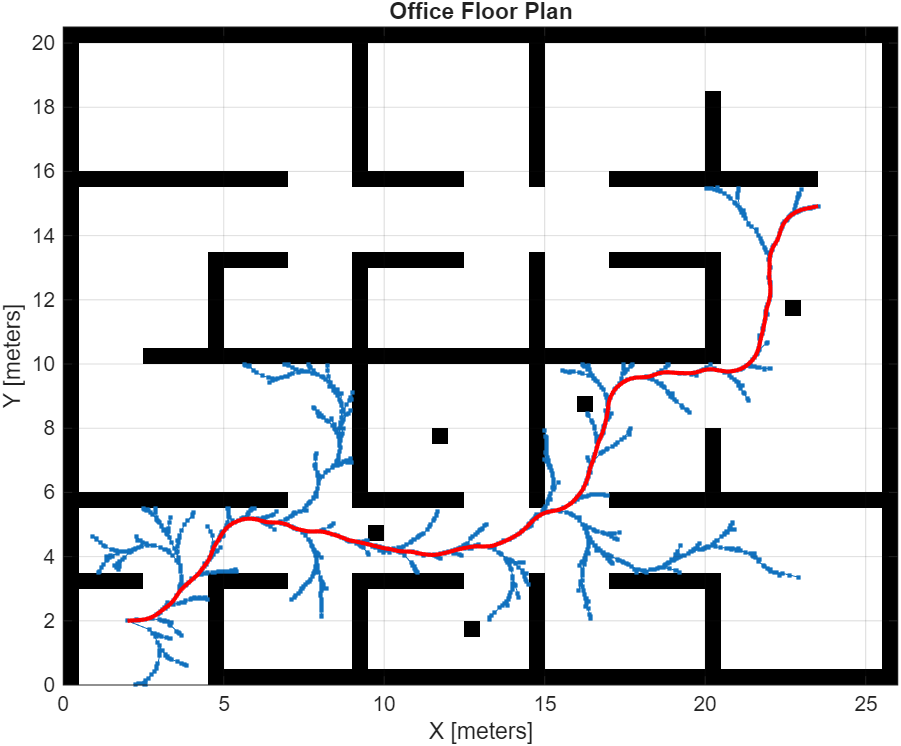
MATLAB implementation of a Rapidly-exploring Random Tree path-planning simulation using an office floor-plan environment. The project demonstrates map loading, obstacle representation, Dubins state-space planning, occupancy-map validation and path generation through a constrained workspace.

The simulation was developed in MATLAB using Robotics System Toolbox functions. Published evidence includes the generated figure and the visible source-code excerpt.

MATLAB Robotics System Toolbox RRT Path planning Dubins state space Occupancy maps Simulation

Technical method

The script loads a predefined occupancy-map environment, applies obstacle data, defines a Dubins vehicle state space and uses an RRT planner to search for a route between the start and goal states. The resulting tree expansion and final path are plotted over the office floor plan.

Published evidence

The output figure shows the obstacle field, tree exploration and final planned path. The MATLAB source code is shown alongside the generated output.

Simulation output and MATLAB code

MATLAB RRT path-planning output showing an office floor plan, tree expansion and final path
MATLAB RRT path-planning output. The blue tree shows sampled route exploration; the red line shows the final planned path through the floor-plan environment.

MATLAB code excerpt

clc;
clear all;

%% Section 1 - Laying out the floor plan
load exampleMaps.mat
whos *Map*

map = binaryOccupancyMap(complexMap, 2);

robotRadius = 0.2;
inflateRadius = 0.1;

mapInflated = copy(map);
inflate(mapInflated, inflateRadius);

% Adding obstacles
x = [12.0; 16.5; 10.0; 13.0; 23.0];
y = [8.0; 9.0; 5.0; 2.0; 12.0];

setOccupancy(map, [x y], ones(5, 1));
show(mapInflated)

%% Section 2 - StateSpaceDubins
stateSpace = stateSpaceDubins;
sv = validatorOccupancyMap(stateSpace);
sv.Map = map;

turningRadius = 0.1;
stateBounds = [0, 24; 0, 22; -pi, pi];
stateSpace.StateBounds = stateBounds;

%% Section 3 - RRT Programme
start = [2, 2, 0];
goal = [24, 15, 0];

planner = plannerRRT(stateSpace, sv, MaxConnectionDistance = 0.2);

rng(100, 'twister');
[pthObj, solnInfo] = plan(planner, start, goal);

show(map)
grid on;
title('Office Floor Plan')
hold on

plot(solnInfo.TreeData(:, 1), solnInfo.TreeData(:, 2), '.-')
plot(pthObj.States(:, 1), pthObj.States(:, 2), 'r-', 'LineWidth', 2)

Interactive Browser Demonstration

A vanilla JavaScript reimplementation of the same algorithm, running live in the browser with no dependencies. Click the canvas once to reposition the start marker, again to reposition the goal, then press Run. The tree expansion is deterministic for a given seed.

Your browser does not support the HTML canvas element.

iterations 0 nodes 1 status: idle

Portfolio Website Development

This portfolio was built using HTML, CSS, and Javascript to present engineering evidence in a structured, maintainable and controlled format. The websites code, structure, and architecture may be viewed by pressing f12. To ensure all animations work on Windows OS, please go to Settings > Accessibility > Visual Effects > Toggle "Animation effects".

HTML5 CSS3 Responsive layout Static site Semantic markup Evidence management Controlled disclosure

Site architecture

Site architecture: pages, shared assets, scripts and data flow. The robotics page is highlighted by default as the exemplar. Hover any page to see its shared dependencies; hover an asset or data node to trace its direct connections. The animated pulses show a live search query travelling from the highlighted page to search-index.json and back.
Pages (HTML) Shared assets Data index.html about.html experience.html cad.html manufacturing-systems.html robotics-automation.html dissertation.html assets/styles.css shared design system site-interactions.js nav, dropdowns, UI search.js Ctrl+K, ranking rrt-demo.js canvas + algorithm build-search-index.js Node build step search-index.json generated at build images / documents / videos per-project trees Outbound query: page → search.js → search-index.json Return: results → search.js → page render

Structure and organisation

Seven live pages (Home, About, Experience, CAD, Manufacturing, Robotics & Automation, Dissertation), a shared stylesheet, and separate images/, documents/ and videos/ trees organised by project. Every page uses the same header, navigation and footer template for consistency.

Navigation and layout

Shared responsive navigation with hover dropdowns for the CAD, Manufacturing, and Robotics & Automation project groups. Layout uses CSS Grid and Flexbox for evidence grids, project cards, and the side-by-side figure/code display used on this page.

Evidence handling

Media is organised per project (images, PDFs, and short MP4 loops for CAD demonstrations). Reports are linked directly as PDFs with visible preview images and captions. Alt text and figure captions are applied consistently for accessibility and clarity.

Controlled disclosure

Industrial content is filtered before publication: no employee names, internal architecture, site-specific images, production rates, equipment locations or confidential drawings are shown. Approved screenshots and loops use visible captions and disclaimers.

Live Data Integration and Visualisation

The below dashboard is an example of consuming a third-party engineering API from the browser and rendering the response as an inline visualisation. The dynamic dashboard makes live requests to the UK National Grid ESO's public Carbon Intensity API on page load and refreshes every five minutes, showing the current grid carbon intensity, the last 24 hours as a sparkline, and the real-time generation mix by fuel type. It is written in vanilla JavaScript with no charting library, degrades gracefully when the API is unreachable, and demonstrates the same principles used when integrating SCADA, MES or IIoT feeds in a manufacturing setting.

Live: UK grid carbon intensity

Loading…
gCO₂/kWh
Carbon intensity — past 24 hours
300 200 100 0
gCO₂/kWh
24h ago 12h ago now
Time
VERY LOW (<100) LOW (100–199) MODERATE (200–299) HIGH ≥300 clips above chart
Generation mix (current half-hour)
Low Carbon
    How this works
    1. On page load, the browser calls the National Grid ESO Carbon Intensity API . This is a free, no-authentication public endpoint published by the UK's electricity system operator.
    2. Two requests are made in parallel: /intensity/date returns the last 24 hours of half-hourly readings for the sparkline, and /generation returns the current mix by fuel type.
    3. The current reading and index label (low / moderate / high) are extracted from the most recent entry and shown as the headline value.
    4. The 24-hour series is drawn to an inline SVG sparkline using a plain path and no charting library. The Y-axis is fixed to 0–300 gCO₂/kWh so fluctuations stay visible across the three ESO index bands that cover typical UK conditions. RAG colouring (green/amber/red) is applied to the bands; readings above 300 gCO₂/kWh clip above the chart, which is itself the intended signal.
    5. The generation mix is rendered as a stacked bar with a colour legend. Percentages come directly from the API and add to 100%.
    6. If any request fails, the dashboard falls back to a "data unavailable" state rather than blocking the rest of the page. Data auto-refreshes every 5 minutes.